Figure 1: DALL-E Generated art depicting this report’s topic. (In the middle of the flag, a python symbol)
The Israeli Occupation of Palestine has turned from a very religiously connotated conflict, allegedly between Muslims and Jewish people, to a human cause. However, Palestinians were always aware this was never about religious hatred. This is Zionism terrorising innocent Muslim, Christian and practising Jewish Palestinian people in the lands of Palestine since 1947.
While it has been 76 years since then, we will focus specifically on the most recent 15 years; 2009-2024. AND, not even on the entirety of Palestine rather just the West Bank, while I’m sure since the 7th of October 2023, everyone has been made aware of the size of the damage in Gaza alone.
This article has the sole purpose of using software such as Google Looker, and Data Visualization libraries in Python to show and display the damage in a way that also serves to highlight my technical skills.
I understand people from my inner circle who read this might not agree with the reasoning behind publicising this article, especially given that the reason I made this website is to showcase my data analysis skills, but when you wake up every day and see images/ videos of innocent children and families that look and speak like you, murdered, severely injured, orphaned through air strikes through no fault of their own, it does do a number on you eventually and survivor’s guilt began to expand in the hearts of almost every Palestinian I know.
For this topic, less is more given how much information and opinions are stated on the internet every day, so, I will use the 8 minutes you have kindly dedicated to this read for you to explore my visualisations rather than discussing them myself, just because I think they are self-explanatory.
Figure 2: A Google Looker report visualising the damage done in the West Bank from 2009 to the present day.
Figure 3: Numbers of people affected by the destructing and conflict in each Governorate in the “Occupied Palestinian Territory”. Click on the pins.
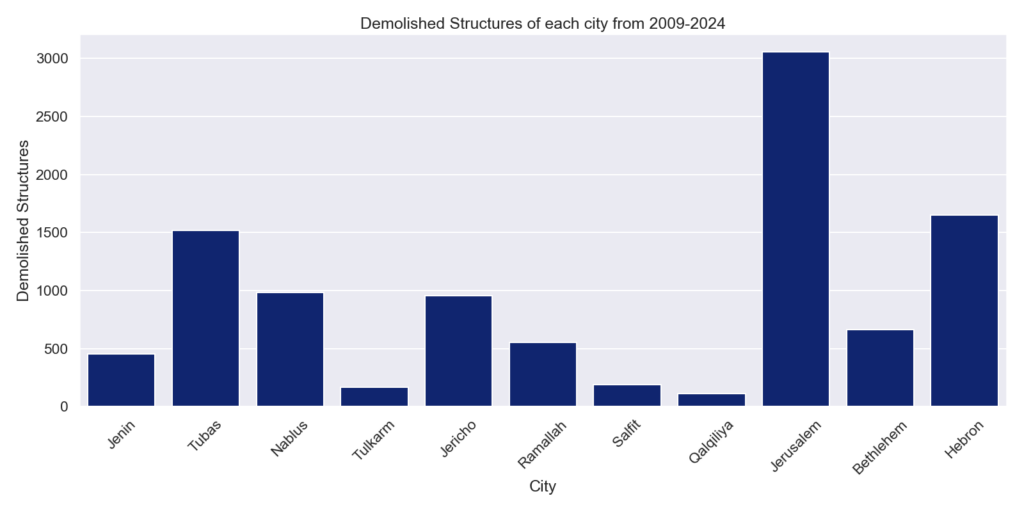
Figure 4: Demolished Structures of each city from 2009-2024.
According to the Data Source, OCHA, “Demolished structures may be residential, livelihood-related, service-related or part of infrastructure. Residential structures – homes, certain parts of homes, apartment buildings etc. – may be inhabited (in which case their demolition typically results in displacement) or uninhabited (for example, if they are under construction). Livelihood structures may include shops, animal shelters, walls, warehouses and more. Structures that are part of infrastructure may include water pipes, roads, and network facilities, among others.”
Data Source: United Nations Office for the Coordination of Humanitarian Affairs (OCHA)
https://data.humdata.org/dataset/state-of-palestine-idp-s
Code: https://colab.research.google.com/drive/1gQfMdKUrecbgL2f57Z5ZdlwYbkFbbqbQ?usp=sharing